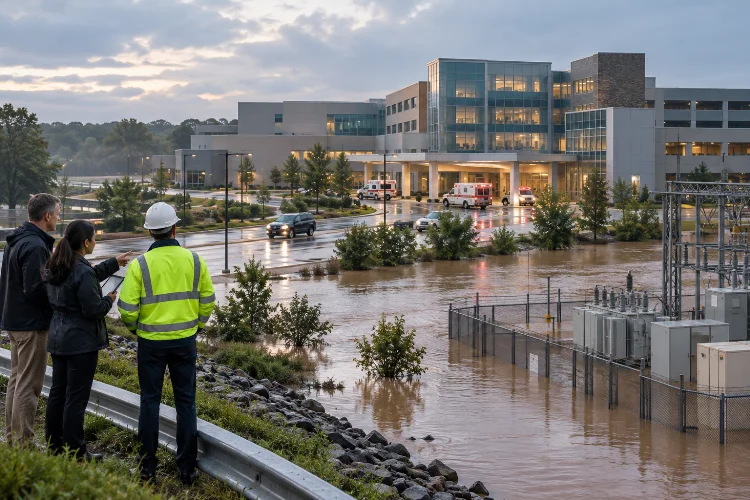
Imagine a major hospital suddenly losing electricity during a flood. The building itself might remain structurally sound, but flooded electrical substations, blocked access roads, and damaged backup generators could disrupt essential medical services.
Now imagine something similar happening to a water treatment plant, transportation network, or power generation facility.
The consequences could extend far beyond the flooded location.
This is exactly why probabilistic flood hazard assessment for critical infrastructure has become an increasingly important part of modern engineering and disaster risk management.
Traditional flood studies often focus on a limited selection of design events. While these approaches remain valuable, they may not fully explain the likelihood of different flood intensities or the uncertainty surrounding extreme events.
Probabilistic methods offer a broader perspective.
By combining statistical analysis, hydrological modeling, hydraulic simulations, and uncertainty evaluation, engineers can estimate how frequently different flood conditions might affect important facilities.
More importantly, these assessments help decision-makers understand which infrastructure systems deserve additional protection.
In this guide, we’ll explore the essential concepts, practical modeling techniques, and engineering strategies behind reliable probabilistic flood analysis.
1. Understanding Probabilistic Flood Hazard Assessment
Flooding isn’t always predictable, even when engineers have decades of rainfall and river flow measurements.
Storms vary in intensity, watershed conditions change, and infrastructure can experience flooding from multiple sources.
Probabilistic flood analysis helps represent this uncertainty in a structured, measurable way.
What Makes Probabilistic Assessment Different?
Traditional deterministic flood assessments evaluate hydraulic conditions associated with selected scenarios.
For example, engineers might simulate a flood with a specified peak discharge to estimate water levels around a bridge or industrial facility.
A probabilistic approach takes things further by examining the likelihood of different flood intensities.
Instead of asking only, “How deep could the water become?” engineers also ask, “How likely is that depth to be exceeded in a particular year?”
This distinction allows infrastructure planners to consider a wider range of possible outcomes.
The result is a better understanding of flood frequency, inundation severity, and uncertainty.
Understanding Annual Exceedance Probability
One of the most important concepts in flood hazard analysis is Annual Exceedance Probability, commonly abbreviated as AEP.
AEP represents the probability that a specified flood magnitude will be equaled or exceeded during a given year.
For example, a flood with a 1% AEP has a 1-in-100 chance of being exceeded in any individual year, assuming the estimated probability remains applicable.
That doesn’t mean the flood happens exactly once every 100 years.
Two major floods could occur in consecutive years, while another location might experience decades without a comparable event.
Under a constant annual probability and independent-year assumption, the chance of experiencing at least one 1% AEP exceedance over 30 years is:
P = 1 − (1 − 0.01)^30 ≈ 26%
That’s a useful reminder that relatively uncommon annual events can become significant over an infrastructure asset’s operating life.
Flood Hazard Versus Flood Risk
These terms are closely related, but they aren’t interchangeable.
Flood hazard describes the probability and physical characteristics of flooding, including water depth, velocity, duration, and extent.
Flood risk also considers exposure, vulnerability, and potential consequences.
For example, a remote floodplain and a hospital campus might experience similar flood depths but face dramatically different consequences.
Understanding this difference helps engineers connect hazard assessment with meaningful infrastructure protection decisions.
2. Collecting Reliable Data for Flood Frequency Analysis
Before building a probabilistic model, engineers need a dependable dataset.
This may sound straightforward, but flood records are rarely perfect.
Measurement gaps, changing land use, uncertain historical events, and limited observation periods can complicate even basic calculations.
Historical Streamflow and Rainfall Records
Streamflow measurements provide valuable information about how rivers respond to rainfall and other watershed conditions.
Annual peak discharge records are particularly useful for estimating flood frequency.
Rainfall observations provide another essential data source, especially when direct river measurements are unavailable or incomplete.
In the United States, NOAA Atlas 14 provides precipitation-frequency estimates for different storm durations and annual exceedance probabilities.
These datasets are frequently used in drainage design and hydrological investigations.
However, precipitation frequency shouldn’t be confused with flood discharge frequency.
A rainfall event with a particular AEP doesn’t necessarily generate a river flood with the same probability because runoff depends on soil moisture, watershed conditions, storage, and rainfall distribution.
Using Modern Geospatial Information
Digital elevation models help engineers represent terrain elevations and identify potential flow pathways.
LiDAR surveys can provide highly detailed topographic information, particularly around floodplains and developed areas.
Satellite imagery can also help identify land cover, river changes, and historical inundation patterns.
For critical infrastructure, detailed local surveys are especially valuable.
A difference of just a few centimeters in ground elevation can sometimes determine whether floodwater reaches an equipment platform or enters a vulnerable building.
Handling Incomplete Historical Records
What happens when a stream gauge has only 20 years of measurements, but engineers need to estimate an extremely rare flood?
Simply extending the historical trend can create substantial uncertainty.
The USGS Bulletin 17C guidelines provide established methods for flood frequency estimation using annual peak flows, historical information, and regional statistical techniques.
These methods include the Expected Moments Algorithm, which can incorporate different types of flood observations.
Historical flood evidence and regional data may improve estimates when local measurements are limited.
Even so, extrapolation far beyond observed conditions requires careful evaluation.
A longer dataset doesn’t automatically guarantee perfect predictions, but a well-documented and consistant data foundation can greatly improve assessment credibility.
3. Selecting Advanced Statistical and Probabilistic Methods
Once the available data have been reviewed, the next step is choosing appropriate statistical methods.
There isn’t one universal model that works perfectly for every river basin or infrastructure site.
The best choice depends on the available observations, local hydrology, and the decisions the analysis needs to support.
Flood Frequency Distribution Models
Probability distributions describe how likely different flood magnitudes are to occur.
The Log-Pearson Type III distribution has an established role in US federal flood frequency analysis.
Other models, such as the Generalized Extreme Value distribution and Generalized Pareto distribution, are also used in extreme value analysis.
Each distribution makes assumptions about the statistical behavior of flood events.
Engineers should evaluate whether those assumptions are reasonable for the dataset being analyzed.
Goodness-of-fit diagnostics, parameter uncertainty, and the influence of unusual observations all deserve attention.
Choosing a distribution only because it produces the largest or smallest design flood isn’t a reliable strategy.
Monte Carlo Simulation
Monte Carlo simulation helps engineers explore uncertainty through repeated calculations.
Instead of assuming that every input parameter has one exact value, the model samples possible values from defined probability distributions.
For example, a flood simulation might incorporate uncertainty in peak discharge, channel roughness, and downstream water levels.
Thousands of model realizations can reveal a range of possible inundation conditions.
This approach is particularly useful when evaluating infrastructure systems with several interacting uncertainties.
However, simulation quality still depends on the assumptions and probability distributions used.
Running 100,000 simulations doesn’t automatically make inaccurate input data more trustworthy.
Bayesian Methods
Bayesian analysis allows engineers to update probability estimates when new evidence becomes available.
Imagine a river basin with limited streamflow records but useful information from nearby watersheds.
A Bayesian framework can combine available prior knowledge with observed data to estimate uncertain flood frequency parameters.
As additional measurements become available, those estimates can be updated.
This is valuable for infrastructure that will remain operational for several decades.
However, prior assumptions should be documented and tested because they can influence results, especially when observations are limited.
Accounting for Nonstationary Conditions
Traditional flood frequency methods often assume that the statistical properties of flooding remain stable over time.
That assumption may become less appropriate when climate conditions, watershed development, or flood regulation change.
Nonstationary models allow distribution parameters to vary with time or explanatory variables.
For example, engineers might investigate relationships between extreme precipitation and changing climatic conditions.
But nonstationary modeling also introduces additional uncertainty.
A model should demonstrate why changing statistical relationships are appropriate rather than automatically assuming that every location experiences increasing flood frequency.
4. Integrating Hydrological and Hydraulic Flood Models
Statistical analysis estimates how frequently different events may occur.
However, infrastructure engineers also need to understand what happens when those events reach a particular location.
This is where hydrological and hydraulic simulations become essential.
From Rainfall to River Discharge
Rainfall-runoff models transform precipitation into runoff and river flow estimates.
They account for processes such as infiltration, surface runoff, watershed storage, and channel routing.
Software such as HEC-HMS can support rainfall-runoff simulation for different storm scenarios.
These calculations provide inflow hydrographs for subsequent hydraulic analysis.
An accurate hydrograph represents more than a single peak discharge.
The timing, volume, and duration of floodwater can strongly influence flooding around important facilities.
One-Dimensional and Two-Dimensional Hydraulic Modeling
One-dimensional hydraulic models are useful when the main flow direction follows a defined river channel.
They calculate water surface elevations and flow characteristics along the modeled river system.
Two-dimensional models provide greater spatial detail.
They represent water movement across floodplains, roads, urban surfaces, and complex terrain.
The U.S. Army Corps of Engineers’ HEC-RAS software supports both approaches, including combined 1D/2D simulations and flood inundation mapping.
For a hospital complex or electrical substation, two-dimensional modeling may reveal how floodwater enters through low-lying access roads or drainage corridors.
These flow pathways might not be obvious from a simplified river cross-section analysis.
Creating Probabilistic Flood Inundation Maps
Traditional flood maps commonly display boundaries associated with selected flood frequencies.
Probabilistic inundation mapping can go further by combining hydraulic simulations with uncertainty in inflows, boundary conditions, terrain, and other model parameters.
For example, engineers might estimate the probability that water depth exceeds 0.5 meters at a substation entrance.
Another map could show the probability of exceeding a specified critical floor elevation.
These outputs are particularly useful for identifying vulnerable equipment and operational thresholds.
However, a probability map should be accompanied by clear explanations of its assumptions, uncertainty, and spatial resolution.
5. Assessing Flood Hazards for Different Infrastructure Systems
Not all critical infrastructure responds to flooding in the same way.
A bridge, electrical substation, and wastewater treatment plant may occupy the same floodplain but have very different failure mechanisms.
That’s why flood assessment needs to consider the specific functions and vulnerabilities of each asset.
Power Plants and Electrical Substations
Electrical infrastructure can be highly sensitive to water intrusion.
Floodwater may damage transformers, switchgear, control panels, and essential electrical connections.
Even relatively shallow inundation can disrupt operations when critical equipment is located close to ground level.
Engineers should therefore evaluate flood depth against actual equipment elevations.
Flood duration also matters because prolonged exposure may increase damage and delay recovery.
Another important consideration is whether access routes remain usable during an emergency.
Bridges and Transportation Networks
Bridges face several flood-related hazards beyond direct inundation.
High flow velocities can cause scour around foundations, while floating debris may accumulate near piers.
Floodwater can also damage approach roads or isolate essential transportation corridors.
A probabilistic analysis should evaluate relevant combinations of water depth, velocity, duration, and potential scour.
For transportation networks, the consequences extend beyond the bridge itself.
Closing one important crossing may disrupt emergency services, supply chains, and regional mobility.
Hospitals and Water Treatment Facilities
Hospitals require dependable electricity, clean water, transportation access, and communication systems.
Flooding can interrupt several of these services simultaneously.
Water treatment plants may experience additional problems when pumps, electrical components, or treatment processes become unavailable.
For these facilities, the assessment should consider not only direct physical damage but also interruption of essential services.
Emergency generators, pumps, and control systems should be evaluated at their actual installed elevations.
Sometimes, protecting one particularly vulnerable component provides much greater benefit than raising an entire facility.
Interconnected Infrastructure Risks
Modern infrastructure networks are highly interconnected.
A flooded substation may interrupt power to a pumping station, which could worsen drainage problems elsewhere.
Similarly, road closures may prevent repair crews from reaching damaged water supply facilities.
These cascading effects make critical infrastructure risk assessment more challenging.
Infrastructure dependency models can help identify situations where one local disruption causes wider service failures.
Understanding these relationships is essential when deciding which facilities require the highest level of resilience.
6. Quantifying Uncertainty and Evaluating Flood Consequences
Every flood model contains uncertainty.
The challenge isn’t eliminating uncertainty completely, because that isn’t realistic.
Instead, engineers need to measure it, understand its sources, and communicate it clearly.
Different Sources of Uncertainty
Aleatory uncertainty describes natural variability in processes such as rainfall and flood occurrence.
Epistemic uncertainty results from incomplete knowledge, including uncertain model parameters or limited observations.
For example, the exact timing of a future extreme storm involves natural variability.
Uncertainty about a channel’s Manning roughness coefficient may be reduced through additional measurements and calibration.
Both types influence flood hazard estimates.
An effective assessment should distinguish them whenever possible rather than combining every uncertainty into one unexplained number.
Sensitivity and Reliability Analysis
Sensitivity analysis identifies the variables that most strongly influence predicted flood conditions.
For example, engineers might vary discharge estimates, downstream boundary levels, terrain elevations, and roughness parameters.
If small changes in terrain elevation produce major changes in infrastructure inundation, additional surveying may be worthwhile.
Reliability analysis connects hazardous conditions with infrastructure performance.
For example, a pumping station may become unavailable when floodwater reaches a critical electrical component.
A fragility function can represent the conditional probability of equipment failure at different flood depths.
However, the probability of equipment failure is not the same as the probability of the flood itself.
These relationships must be combined correctly when estimating operational risk.
Estimating Expected Annual Damage
A common economic risk indicator is Expected Annual Damage, or EAD.
It represents average annual flood damage under the assumptions of a defined probabilistic model.
The USACE HEC-FDA framework calculates this measure by integrating relationships among flood frequency, hydraulic conditions, and damage.
Consider a simplified hypothetical example involving two mutually exclusive flood severity categories.
Suppose moderate flooding has an annual probability of 4% and causes $1 million in damage, while severe flooding has an annual probability of 1% and causes $8 million.
Expected annual damage would be:
EAD = (0.04 × $1,000,000) + (0.01 × $8,000,000)
EAD = $120,000 per year
This example is intentionally simplified. Real assessments use more complete damage-probability relationships and address uncertainty, overlapping exceedance thresholds, and additional consequences.
Expected annual damage is also not the maximum possible loss.
For hospitals, power networks, and other essential services, decision-makers should evaluate service interruption, recovery time, and public safety alongside economic damage.
7. Improving Infrastructure Resilience Through Risk-Informed Decisions
The real value of probabilistic flood modeling becomes clear when its results influence infrastructure planning.
A detailed flood hazard map is useful, but a practical protection strategy is even better.
The goal is to turn complex probability estimates into decisions that improve long-term safety and reliability.
Prioritizing Flood Protection Investments
Infrastructure owners often face limited budgets and competing maintenance requirements.
Risk-informed assessments can help identify where additional protection provides the greatest benefit.
For example, an electrical substation with a relatively high probability of damaging inundation may require urgent attention.
Another facility may face less frequent flooding but much greater consequences if operations fail.
Comparing probability, vulnerability, and consequences helps establish priorities.
However, decisions should also reflect regulatory obligations, acceptable risk criteria, and the essential functions of each facility.
Evaluating Structural and Operational Measures
Flood resilience measures can include raised equipment platforms, flood barriers, improved drainage systems, waterproof enclosures, and alternative access routes.
Operational measures may include early warnings, emergency shutdown procedures, temporary barriers, and backup power arrangements.
A probabilistic model can compare conditions before and after proposed improvements.
For example, raising an electrical control panel above a modeled flood threshold might significantly reduce the probability of direct water damage.
However, the improvement may have limited benefit if the facility still loses external power or transportation access.
Considering the entire system helps avoid protection measures that solve one problem while overlooking another.
Planning for Climate and Future Development
Infrastructure often has an expected service life of several decades.
During that time, land use, rainfall patterns, sea levels, and surrounding development may change.
The IPCC Sixth Assessment Report identifies climate-related pressures on urban and critical infrastructure, including flooding and extreme precipitation.
However, future changes in river flooding vary by region and depend on watershed conditions.
This means assessments should consider relevent local climate projections and plausible future scenarios rather than assuming one global trend applies everywhere.
For coastal infrastructure, compound flooding from rainfall, river discharge, and elevated coastal water levels may also require attention.
These hazards shouldn’t always be assessed seperately because their interaction can amplify local flooding.
Updating the Assessment Over Time
Probabilistic modeling shouldn’t be a one-time activity.
New flood observations, improved terrain surveys, updated infrastructure inventories, and better climate information may change previous conclusions.
Periodic reassessment helps maintain the usefulness of hazard estimates.
A practical review process should also document key assumptions, model limitations, and remaining uncertainity.
When engineers communicate these factors transparently, infrastructure owners can make better decisions about future investigations and protective investments.
Ultimately, successful flood resilience planning combines reliable science, experienced engineering judgment, and a clear understanding of how essential services operate.
Probabilistic flood hazard assessment offers a more comprehensive way to understand how extreme flooding may affect critical infrastructure.
By combining flood frequency analysis, statistical modeling, hydraulic simulations, and uncertainty evaluation, engineers can move beyond individual design scenarios and explore a wider range of possible outcomes.
These methods are especially valuable for hospitals, power facilities, transportation networks, and water treatment systems where service interruptions can have serious consequences.
However, accurate predictions depend on reliable observations, appropriate modeling assumptions, and regular validation.
The most effective approach also considers future environmental changes and interconnected infrastructure vulnerabilities.
Ready to strengthen your infrastructure flood resilience strategy? Start by reviewing historical flood data, identifying critical equipment elevations, and evaluating probabilistic inundation scenarios.
These practical steps can support smarter investments, stronger emergency planning, and safer infrastructure over the long term.